|
Vaughan Family Timestream® Maps |
| Home Biography People Places Multimedia: Making It Work On the Water Writings/Presentations |
Tick Drags
Scientists' Cliffs, Maryland
Tick Drag at the Ball Field
Port Republic,
Maryland, 20676
May 20, 2018
by
Tay Vaughan, Marcia van Gemert, Fran Armstrong, Bruce Armstrong
Download PDF version of this report HERE.
 [Click on any image to view]
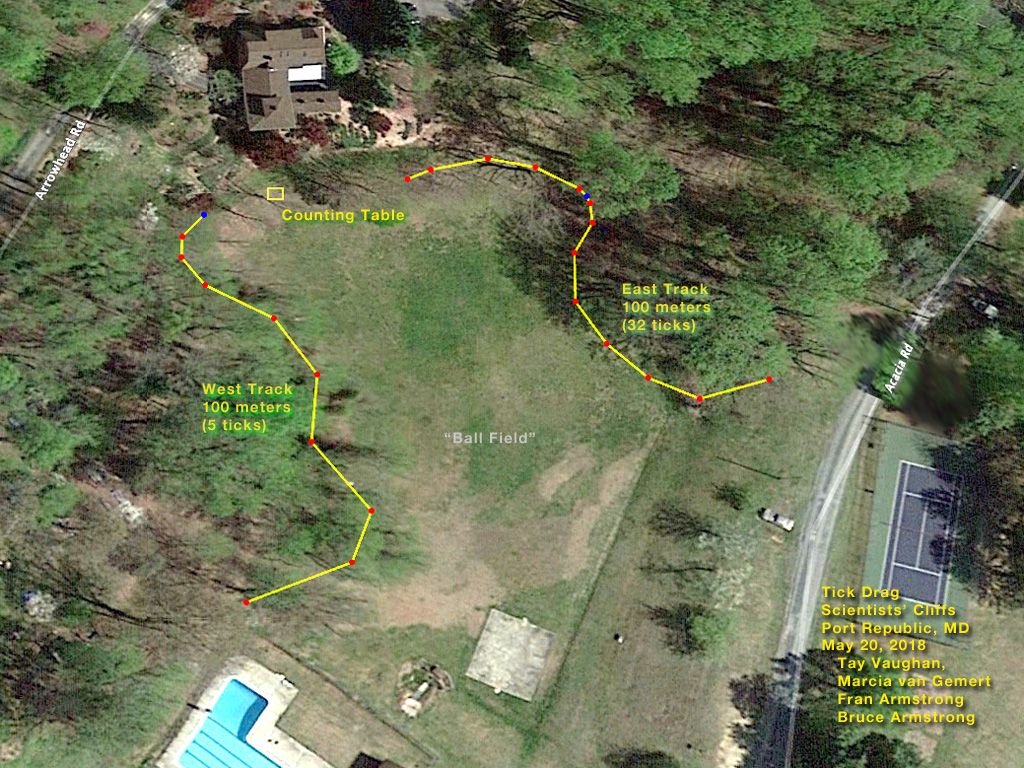
Figure 1. Map. Two tracks of 100 meters each were chosen for the drag. As they run along maintained community-owned property, it is likely that the nature of the tracks will not change over time.
Abstract
Scientists’ Cliffs is a small community of some 240 homes overlooking the western shore of the Chesapeake Bay in Calvert County in Southern Maryland. On May 20, 2018, following a week of torrential rain (between seven and nine inches were reported with serious cliff erosion), two 100-meter tracks (see Fig. #1, Map) had dried sufficiently for the tick drag. A one-sq-meter piece of white felt was dragged along each track and the collected ticks counted. The western track drag yielded five ticks. The eastern track drag yielded thirty-two ticks. All ticks collected were “deer ticks” (Ixodes scapularis), mostly in the nymph growth stage (See Fig. #2, Identification Card).
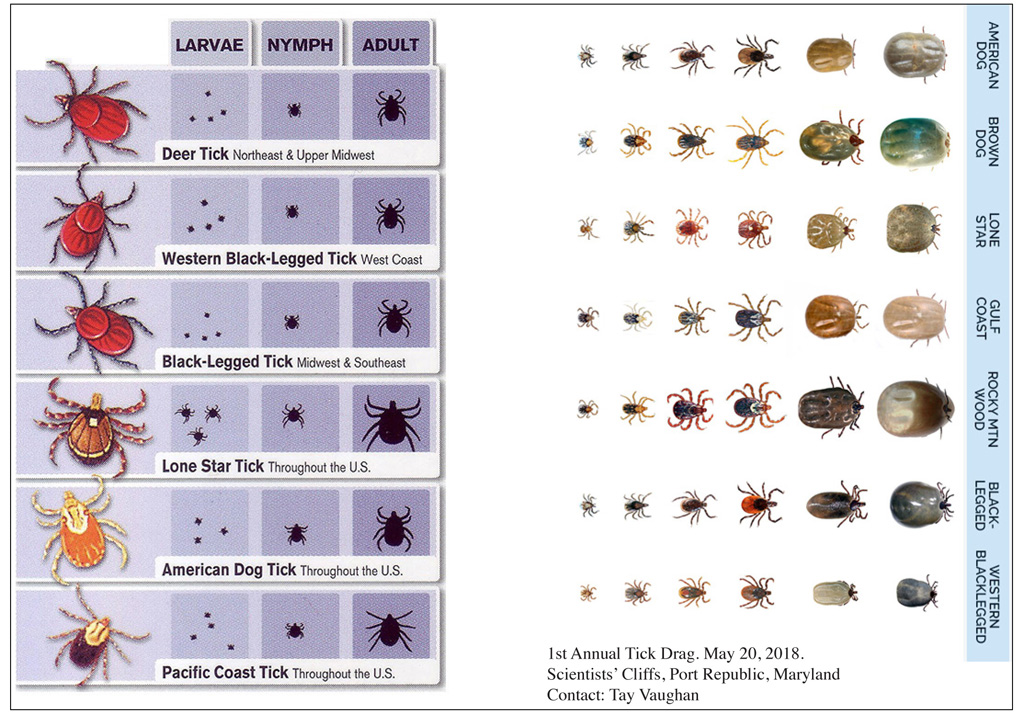
Figure 2. Identification Card. Participants were provided plastic cased tick identification cards to help with counting and sorting. More than a dozen cards remained available at the conculsion of the drag. Please contact Tay Vaughan if you would like a card for your own library.
Introduction
In the Scientists’ Cliffs community there has been continuing discussion about methods for reducing the population of ticks, particularly deer ticks (Ixodes scapularis) which carry Lyme disease (Borrelia burgdorferi). The primary method proposed has been thinning of the white-tailed deer population by selective hunting; that solution was proposed by a special committee but the plan failed to garner sufficient votes within the community in 2017. Currently, there is no community-sponsored program aimed at reducing the tick population at Scientists’ Cliffs.
Indeed, the density of the tick population at Scientists’ Cliffs is unknown. Our “Tick Drag Project,” described in this report, was developed to provide a simple, repeatable counting methodology and to enlist community members to gather data in pathways and other areas of human-tick interaction. A simple database was designed using Excel.
We began by dragging two tracks adjacent to community-owned property - 100-meter stretches along the east and west edges of the “Ball Field.” These tracks were chosen because they should be available for repeated dragging season-to-season and year-to-year. A traditional summer concert at this location draws many who sit in the grass. Other tracks in the community, such as along ravine trails and walking paths, may be denser in ticks (and consequently more dangerous), and may be identified and dragged in the future. Other measurement methodologies for determining tick density include dragging a given area for a given amount of time, then counting the ticks that have climbed aboard the drag.
Ticks do not jump, fly, run, or fall from trees.
...Hard ticks seek hosts by an interesting behavior called “questing.” Questing ticks crawl up the stems of grass or perch on the edges of leaves on the ground in a typical posture with the front legs extended, especially in response to a host passing by. Certain biochemicals such as carbon dioxide as well as heat and movement serve as stimuli for questing behavior. Subsequently, these ticks climb on to a potential host which brushes against their extended front legs.”
[http://entomology.ucdavis.edu/Faculty/Robert_B_Kimsey/Kimsey_Research/Tick_Biology/]
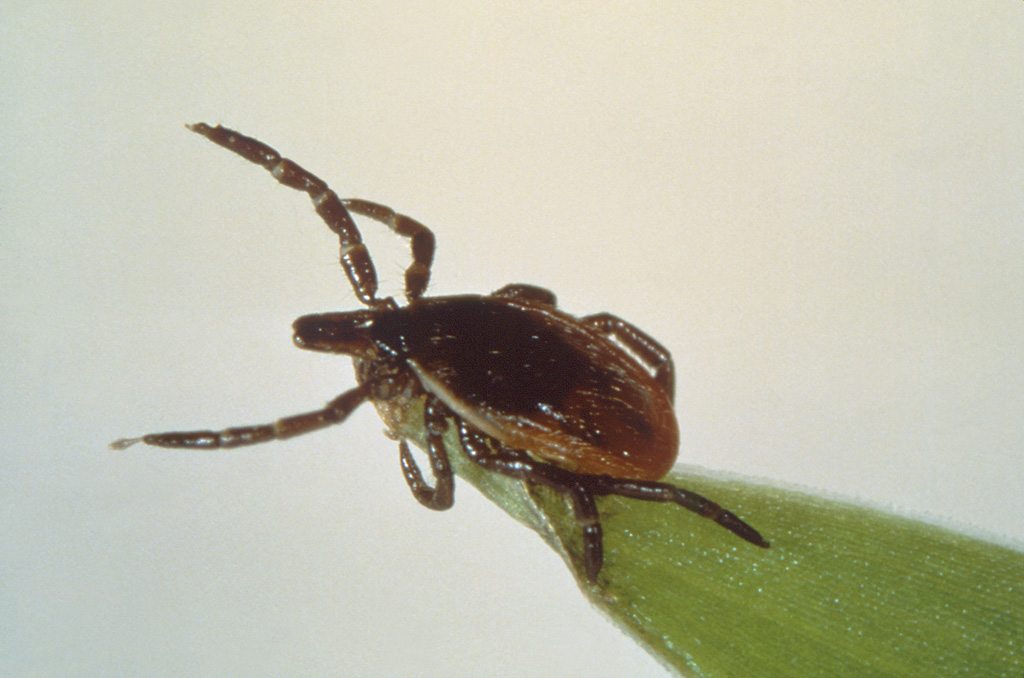
Figure 3. Questing Tick. Photo courtesy of the Centers for Disease Control and Prevention.
Unfortunately, our study at Scientists’ Cliffs does not include a method to discover the number of questing ticks infected by pathogenic spirochetes (Borrelia burgdorferi) or other harmful microbes. It simply indicates tick density by the number of specimens collected per distance dragged, per area dragged, or per time dragged. Estimates of the number of deer ticks that actually carry the pathogenic bacterium that causes Lyme disease in Maryland vary greatly. The CDC tracks confirmed cases of Lyme disease by state and county.
“The odds of getting Lyme disease from an individual deer tick bite are pretty low: Even in tick-ridden areas, less than 5 percent of bites result in an infection.”
[https://www.sciencenews.org/blog/growth-curve/five-reasons-not-totally-panic-about-ticks-and-lyme-disease]
“[Because] the CDC’s data only represents confirmed cases, the actual quantity of Lyme disease cases may be far greater. We estimate a total of 237,000 true cases of Lyme disease in Maryland 2000 - 2016. We estimate a total of 8,150 true cases of Lyme disease in Calvert County in the same time frame.”
[https://www.tickcheck.com/stats/county/maryland/calvert-county/lyme]
An interesting study to determine the relationship of tick density and life stage to the chances a bite will transmit disease was undertaken in Germany:
“To estimate tick density, we collected questing ticks and extrapolated the number per hour of flagging. Ixodes ricinus was the sole tick species collected. On the pasture, questing ticks were least abundant (p<0.0001, Friedman test; Table 1); 12 nymphs and 2 females attached to the flag within 1 hour. On the meadow, 7× times as many questing nymphs and 5× as many females were collected in 1 hour; on the fallow land, 12× more ticks were collected. Ticks were most abundant on vegetation not modified by mowing or pasturing.... To detect and identify any spirochetes infecting these ticks, we isolated DNA and amplified and sequenced a 16S rDNA fragment (2,8). For differentiation of B. bavariensis (spec. nov. cand [9].) from B. garinii, any DNA sample amplifying B. garinii was included in an outer surface protein A PCR and sequenced (10).”
The German study successfully linked tick density to risk of contracting Lyme disease from a bite, concluding that
“Along this hiking trail, risk for exposure to ticks infected with Lyme disease spirochetes varied considerably with landscape structures. Our observations suggest that hikers are up to 54× less likely to contact a tick infected with pathogenic Lyme disease spirochetes when walking across a cattle-and-goat pasture than when walking along an abandoned area. The presence of zooprophylactic goats and cattle resulted in fewer ticks and a diminished rate of infected ticks within this local population. Extensive landscape management that uses domestic ruminants not only serves to maintain cultural and natural heritage in Germany but also seems to confer a health benefit for hikers and others seeking recreation.”
[https://wwwnc.cdc.gov/eid/article/17/9/10-1523_article]
Richter, D., & Matuschka, F. (2011). Differential Risk for Lyme Disease along Hiking Trail, Germany. Emerging Infectious Diseases, 17(9), 1704-1706.
https://dx.doi.org/10.3201/eid1709.101523.
Method
A “drag” and a “flag” are the two instruments typically used for collecting ticks. Both are made up of a one sq-meter piece of cloth. The first is attached to a dowel and ropes and dragged behind the field worker (See Figure #4); the second is attached to the end of a 1.5m pole and played across leaf litter and bushes by the field worker. In their 2013 study “Flagging versus dragging as sampling methods for nymphal Ixodes scapularis (Acari: Ixodidae),” the authors concluded that
“the numbers collected by each method were so variable that neither technique had a clear advantage for sampling.”
[https://onlinelibrary.wiley.com/doi/pdf/10.1111/j.1948-7134.2013.12022.x]
Our study utilized two drags made of white felt, 36 inches by 42 inches. As this material is locally sold from a bolt 72 inches (2 yards) wide, we purchased a bit more than one yard of the bolt and slit that in half. We prepared two drags, each attached to dowels and ropes (see Fig #4). To compensate for the yard vs meter issue, we lengthened the material in our drag to 42 inches. Now, at 36 inches by 42 inches, results could be measured “per square meter.”
We established two 100 meter tracks using distance measuring tools in Google Earth (see Figure #1), and we dragged along the rough leaf and mulch area just outside of the mowed area of the field (See Fig. #5). At the end of each track, the drag was lifted and carried to a counting table where it was laid out, bottom-side up. Every square centimeter was carefully examined in bright sunlight with magnifying glasses See Figure #6). Ticks were captured with tweezers as shown in Figure #7 and inserted into a specimen bottle through a cover made of latex gloves bound by rubber bands around the top (See Figure #8).
The drag was turned over and ticks on the other side were added to the collection. The drag was brushed clean of leaves and detritus and prepared for re-use.
The specimens were euthanized by 120 seconds in a 1.5kW microwave oven. They were then dropped into a white ceramic bowl for counting and sorting (See Figure #9).
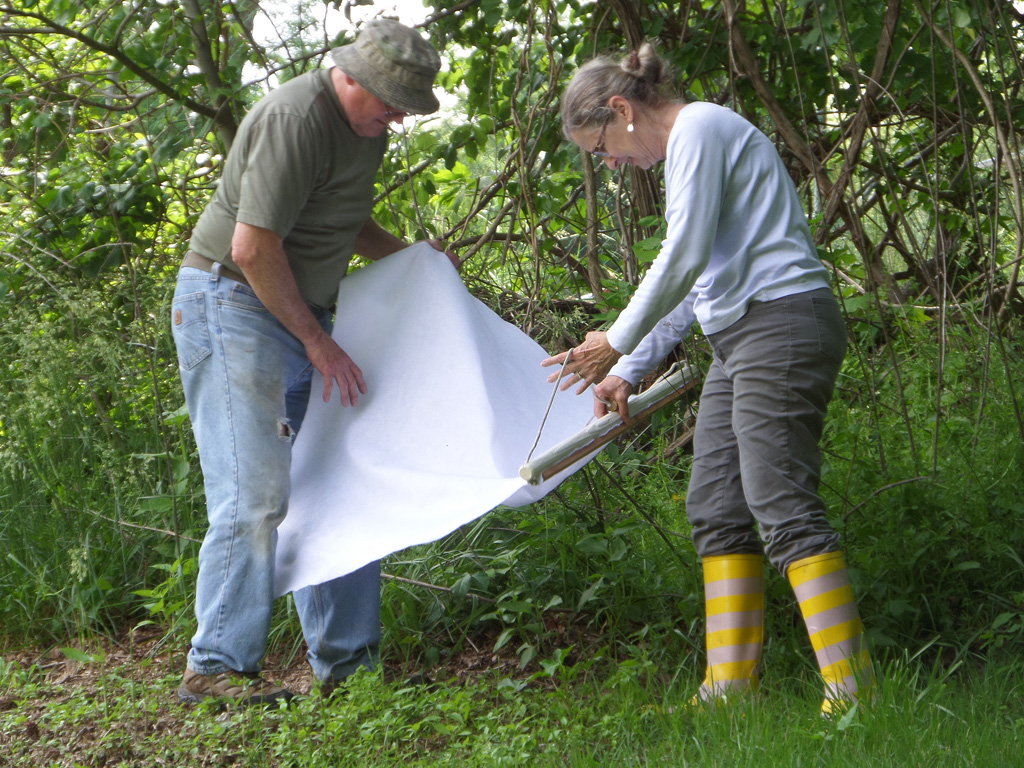
Figure 4. Drag Cloth. For collection tick specimens, 1 sq meter of white felt was used.
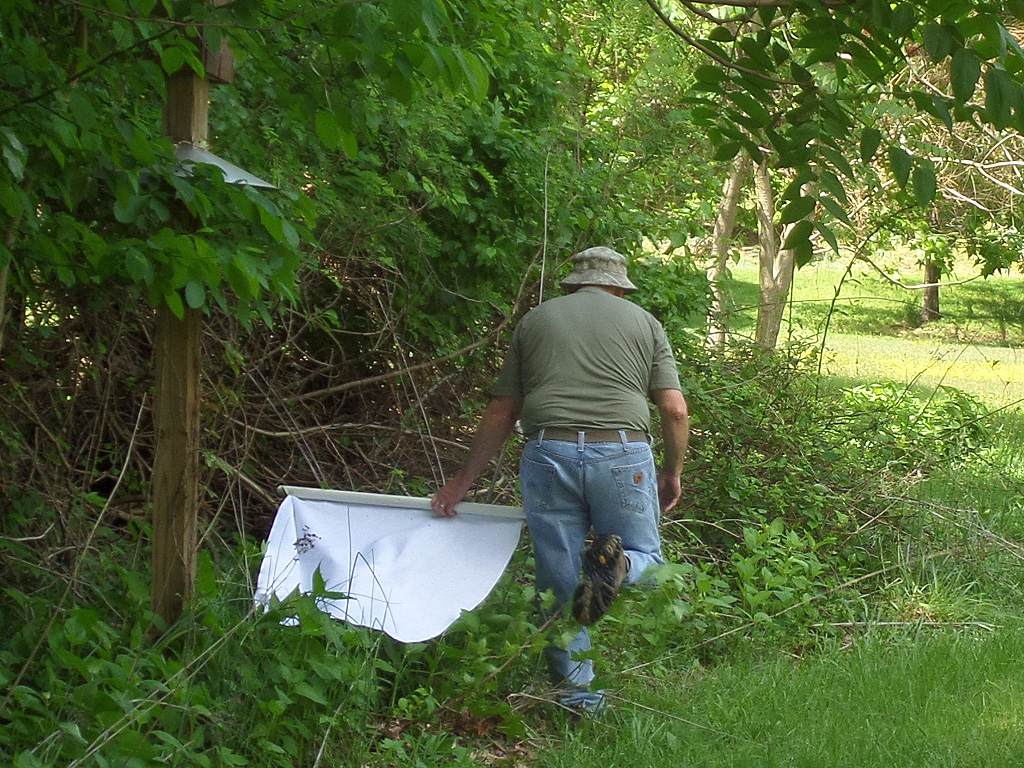
Figure 5. Dragging. The cloth was dragged behind the fieldworker.
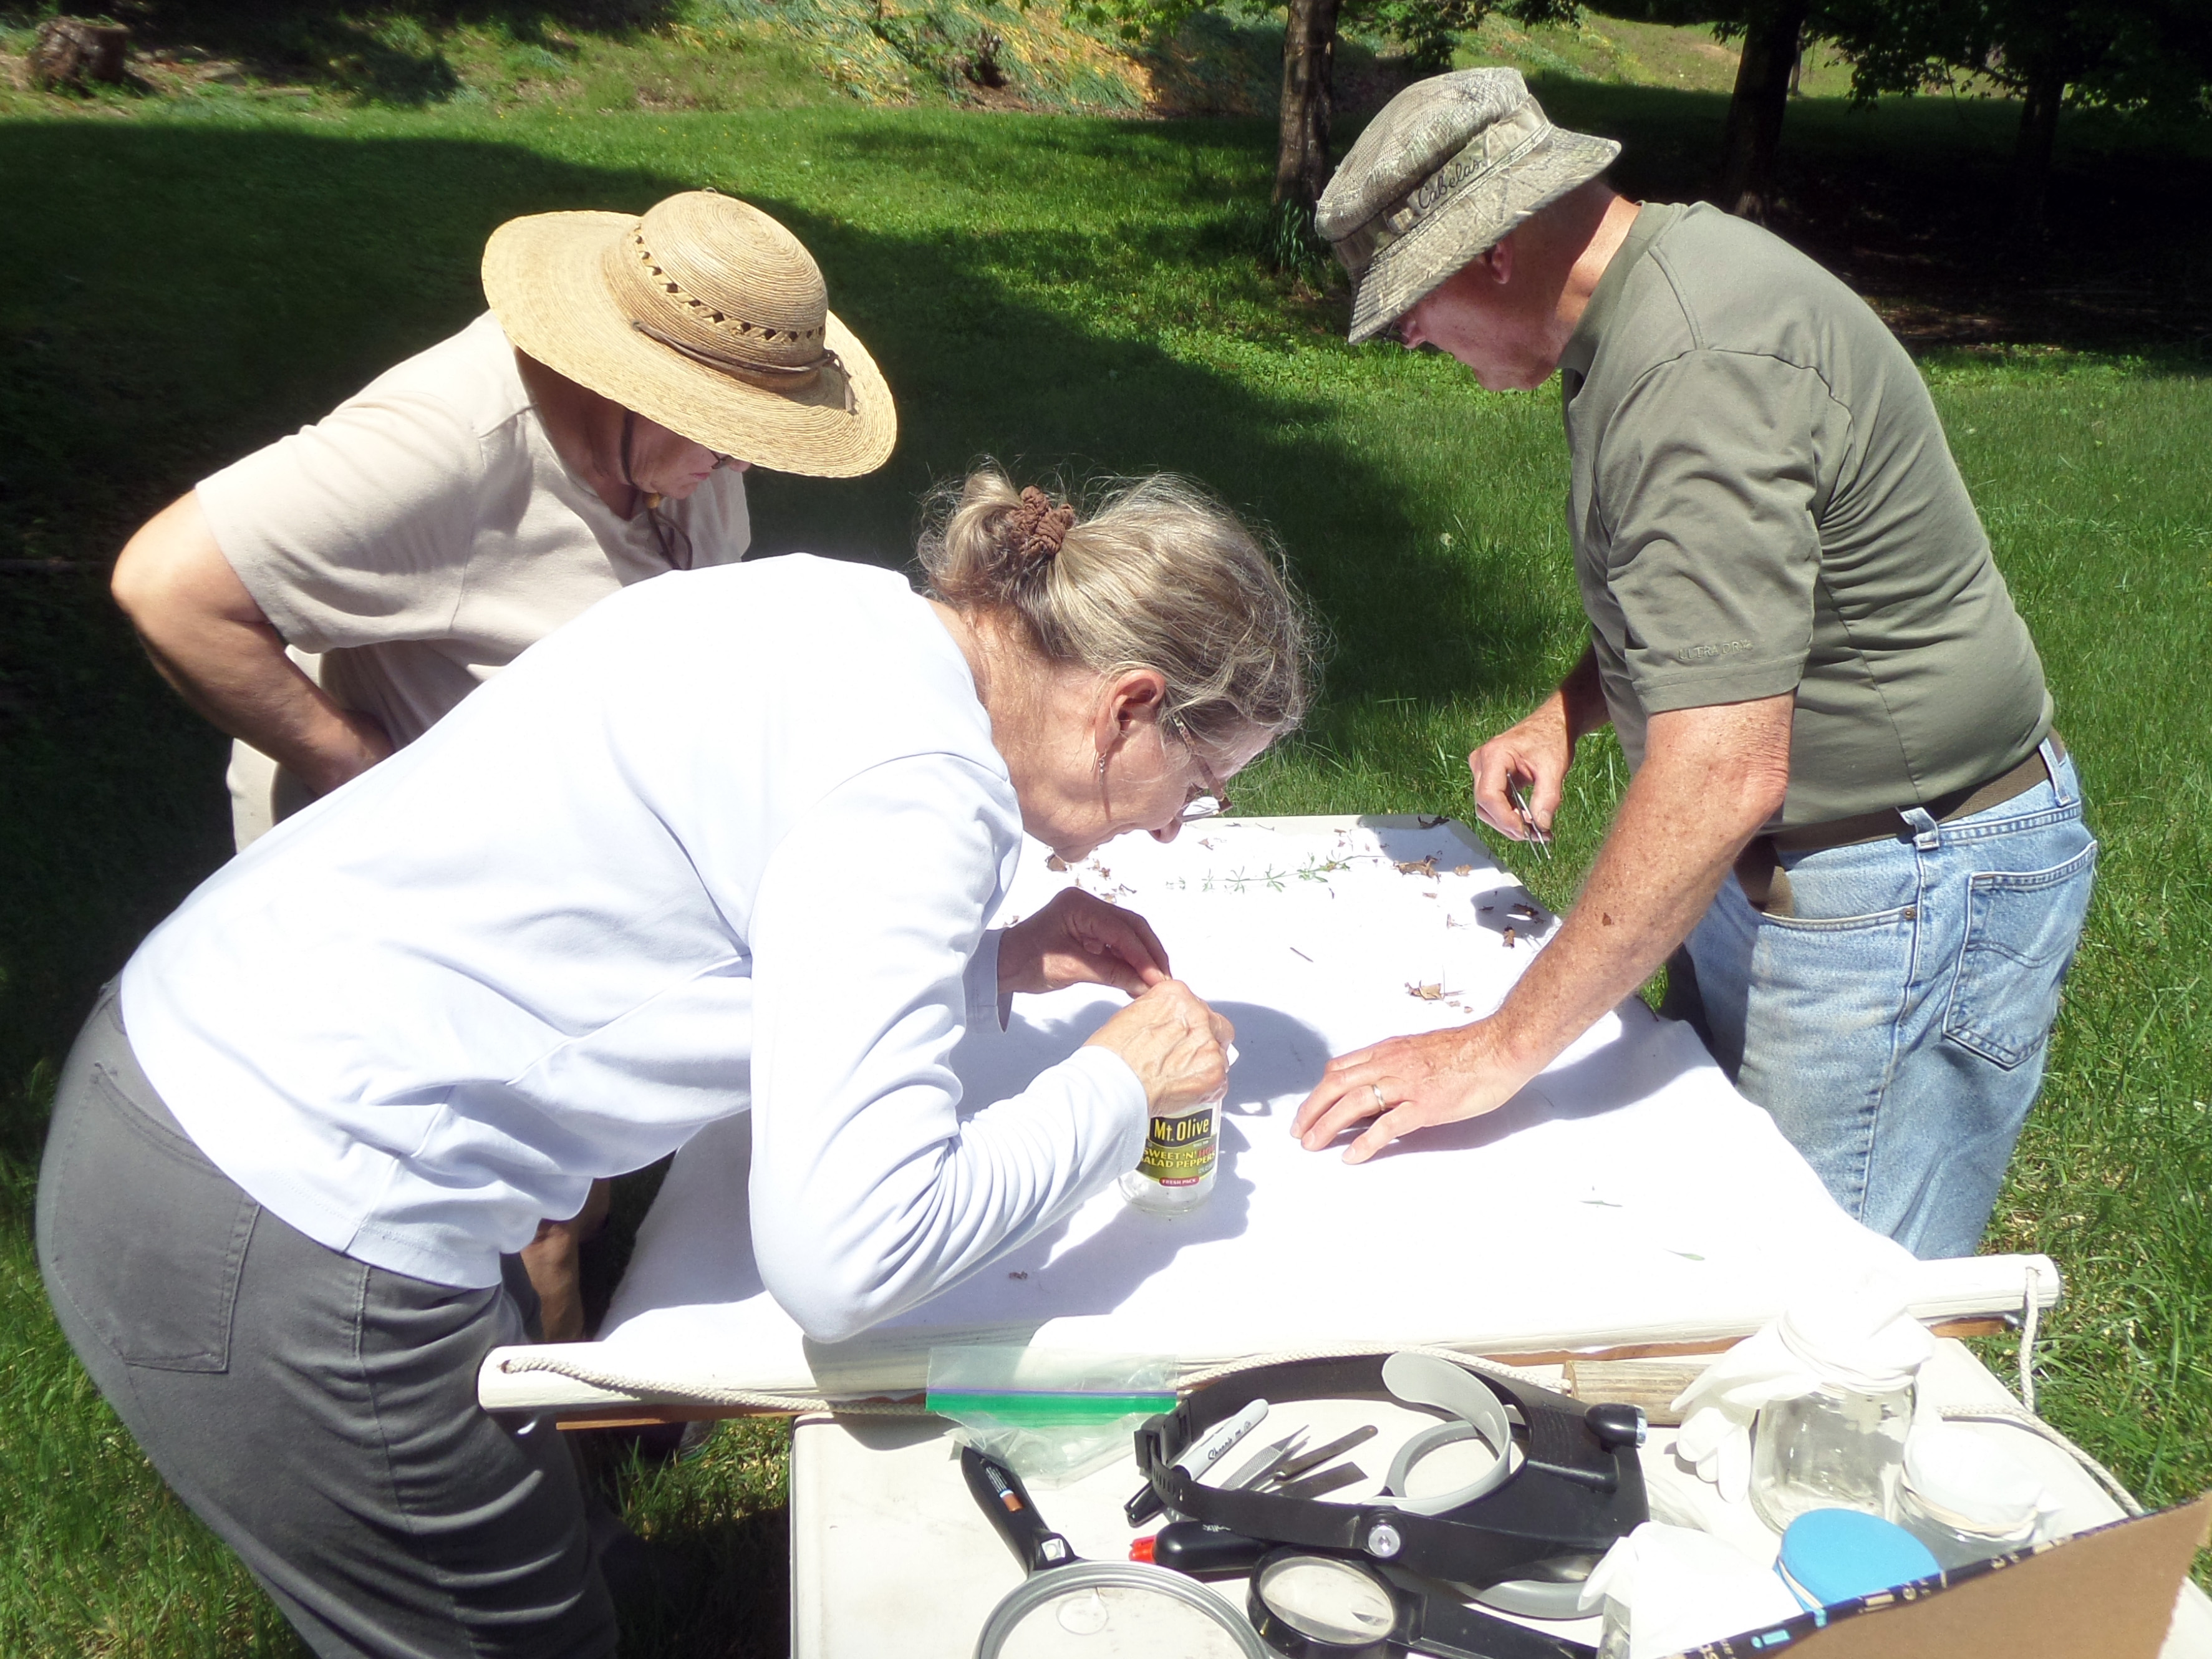
Figure 6. Inspection. The entire surface (both sides) was carefully gleaned of captured ticks.
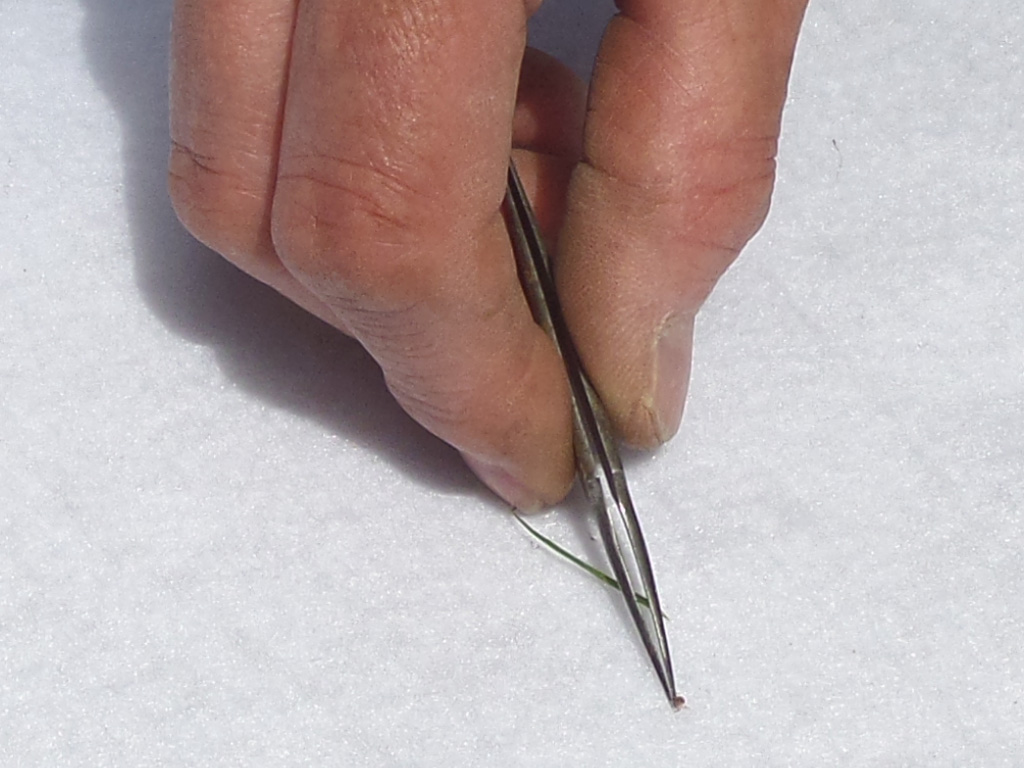
Figure 7. Collecting. The nymphs and larvae can be very tiny.
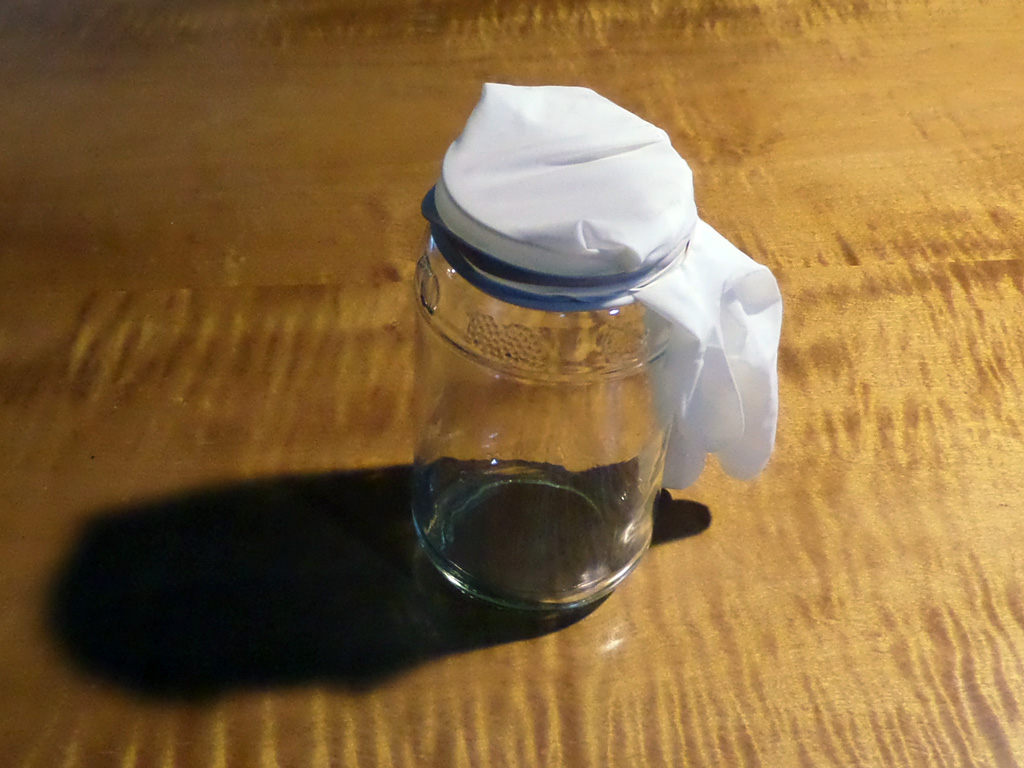
Figure 8. Collection Bottle. Poke tweezers through latex top, release specimen, withdraw.
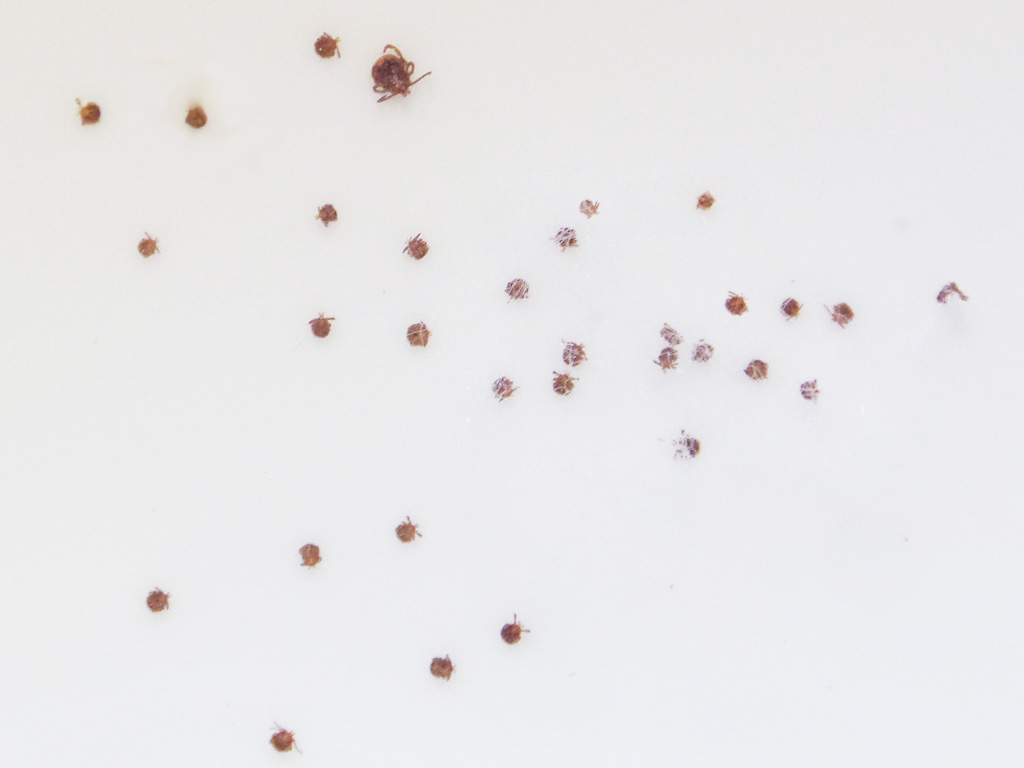
Figure 9. Counting. Euthanized ticks from the Eastern Track are counted and sorted.
Results
Our tick drag along the Western Track of the Ball Field yielded a total of five deer ticks in three stages: one adult, 1 nymph, and 3 larvae. Other species were not found.
Along the Eastern Track of the Ball Field, our drag yielded 32 ticks: one nymph and thirty-one larvae. Only deer ticks (Ixodes scapularis) were found.
The area west of the Western Track had for more than a year been disturbed by home construction and landscaping - brush clearing, tree cutting, and installation of a septic system. We felt it was likely not a popular passage for mice, squirrels, or deer. To the east of the East Track, however, is undisturbed native undergrowth leading to the Chesapeake Bay at Scientists’ Cliffs Ravine #6. It is common to spot deer grazing on this side of the Ball Field.
A simple flat file tab-separated database was developed to record and present our findings, with the notion that subsequent drags would be recorded in the same format. Each drag was assigned an unique ID number and became a “record.” Forbidden characters within data entry fields are “return” and “tab.” Within each drag record the following fields were assigned:
DataField 01: ID Number (four digits)
DataField 02: Drag Name
DataField 03: Location LAT (Decimal Deg.)
DataField 04: Location LONG (Decimal Deg.)
DataField 05: Location Description
DataField 06: Date
DataField 07: Time
DataField 08: Total Deer Ticks
DataField 09: Total Adult Deer Ticks
DataField 10: Total Nymph Deer Ticks
DataField 11: Total Larvae Deer Ticks
DataField 12: Total Lone Star Ticks
DataField 13: Total Adult Lone Star Ticks
DataField 14: Total Nymph Lone Star Ticks
DataField 15: Total Larvae Lone Star Ticks
DataField 16: Total Other Ticks
DataField 17: Total Adult Other Ticks
DataField 18: Total Nymph Other Ticks
DataField 19: Total Larvae Other Ticks
DataField 20: Total All Ticks
DataField 21: Comma-separated Field Worker List
DataField 22: Drag Material
DataField 23: Description of Drag
Our interest was to survey the Deer Tick (Ixodes scapularis) and Lone Star Tick (Amblyomma americanum) populations. Data for other species were lumped into “Other.”
For the East Track of our drag, for example, the following data points were entered:
Field 01: 0001
Field 02: BallField East
Field 03: 38.514341
Field 04: -76.514353
Field 05: 100 meter drag along the east side of the ballfield at Scientists’ Cliffs
Field 06: 20180520
Field 07: 1430
Field 08: 32
Field 09: 0
Field 10: 1
Field 11: 31
Field 12: 0
Field 13: 0
Field 14: 0
Field 15: 0
Field 16: 0
Field 17: 0
Field 18: 0
Field 19: 0
Field 20: 32
Field 21: Tay Vaughan, Marcia van Gemert, Fran Armstrong, Bruce Armstrong
Field 22: White felt
Field 23: Dragged over grasses and leafy matter alongside woods next to mowed field
Discussion
As with many researches, more study is needed. With data points from many drags repeated over several seasons, we may be able to map population densities in important areas of Scientists’ Cliffs. If you are interested in organizing a tick drag for an area of interest, please contact Tay Vaughan for help with information and equipment.